

While the mainstream predictions are fun (if often intentionally "out there" in order to stir up controversy) and the public projection systems are useful (since you can look at projections for individual players and see how they add up to a team total), the most accurate way to predict win totals is usually looking at the Regular Season Win Total (RSW) lines posted at sportsbooks online and in Nevada. Bettors have access to the various public projection systems, so it makes sense that they'd be able to improve on them by incorporating additional information.
For purposes of this exercise, I used the (current as of March 31st, 2015) RSW lines at PinnacleSports.com, an online sportsbook based on the island of Curaçao that is known for having efficient lines thanks to high limits ($2,000 on RSW bets, higher than any other book I could find). High limits are great because if a sportsbook sets a line but isn't willing to take a substantial bet, how confident in that line can they really be?
I took the RSW lines, adjusted for the uneven odds (which ranged from -162 to +138), then plugged those talent estimates into a program that simulated each game of the MLB season 50,000 times.
With those numbers, we can now compare how the playoff odds from the public projection systems match up to what the betting market is currently suggesting. It's an imperfect way to derive playoff odds, since teams may change their behavior to maximize their playoff odds depending on how the season plays out, but it's the best I could come up with. Books will take bets on which team will win each division, but those lines have a much higher vigorish (built-in profit for the book), which means you can only estimate a range of implied probabilities.
To start things off, let's look at the simulated probability of each team winning the AL Central.
The Indians and Tigers are clearly the co-favorites in the AL Central as they are only teams to win the division at least 25 percent of the time in any of the four projections. The Indians are the most consistent, topping 30 percent in all four projections while the Tigers do very well in BP's PECOTA projections but finish a surprising fourth in Clay Davenport's system. When looking at the White Sox and Royals, the betting market sides with Davenport over Fangraphs and BP, giving those both teams a decent chance of winning the division.
Next, we'll look at the Wild Card probabilities.
All four competitive (sorry, Twins fans) AL Central teams won the wild card in 13 percent to 15 percent of the Pinnacle-based simulations. Obviously the Indians and Tigers win the wild card in a higher rate of the seasons in which they don't win the division, but it's interesting to see how close together the top four teams are compared to the other AL divisions.
We can calculate each team's chance of making the playoffs by adding the division championship rate and wild card rate together. However, a better measure of each team's chance at playoff success is the probability of them making it to the Divisional Series. BP and Fangraphs calculate that based on probability of winning the wild card game. For the Pinnacle and Davenport numbers, I simply assumed each wild card would have a 50/50 chance of advancing to the LDS. Here are the results:
After 50,000 simulations, the Indians end up with a 38 percent chance of playing in the ALDS. That's a very good sign, as it's the fourth highest probability of any team in the American League.
One thing I haven't shown yet is the expected win total arrived at by each of these projection systems. When one posts average win totals, they will inevitably receive criticism that their estimates for division winners are too low. Take a look at each AL team's win total as projected by the four systems:
The typical reaction to this list is "There's no way the AL Central Winner will only win 83-84 games! And there will DEFINITELY be AT LEAST one 90 win team!!"
Both of those statements are correct, but they also don't contradict with what the models are actually saying. The models are saying that those are the average win totals for each team. In the seasons in which a team wins the division, their win total is very likely higher than what their average win total was in all the simulations.
With all 50,000 Pinnacle-based simulations easily accessible, we can take a look at the range of win totals and how likely a team is to make the playoffs given a certain number of wins. Here's a graph for the Indians (hover over any circle to see the exact probabilities, or switch to other AL Central teams using the sidebar):
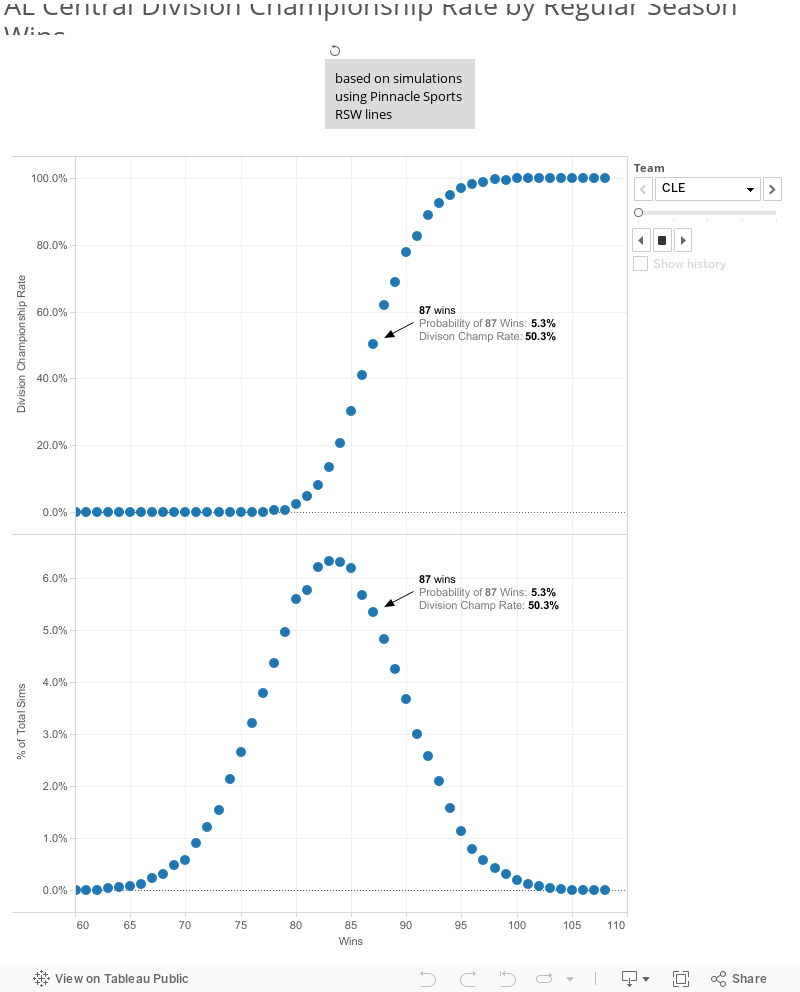
The top half shows the Indians' chance of winning the division given each RSW total. The bottom half shows the probability of them reaching that win total. As indicated by the annotations, the Indians will have a 50-50 shot of winning the AL Central if they can win 87 games, which is just a bit above their median RSW total. If they get up to 90 wins, they'll be sitting at a comfortable 78 percent.
We can also evaluate the AL Central compared to other divisions by looking at the average number of wins by the division winner. Here we can see that it does not fare well compared to the league's five other races:
The Indians are quite lucky to be in the division they are in. The AL Central will likely be a close race, but that is mostly due to the lack of a standout team. In comparison, the San Diego Padres, who have nearly the exact same expected RSW total as the Indians, have only a 19 percent chance of winning the NL West if they win exactly 87 games, far lower than the Indians' 50 percent division championship rate when they win 87 games. The Padres have a better chance of winning a wild card spot with 87 wins (55 percent to 42 percent), but that doesn't make up for the huge difference in division championship odds, as the Indians' LDS rate sits at an MLB-best 71 percent at 87 RSW and the Padres LDS odds at 87 wins is the third worst in MLB at 46 percent.
The presence of the 90+ win Dodgers along with another solid team (the Giants) makes the NL West an extremely difficult division to win if you're not able to top 90 RSW. The same can be said for the NL East, which has the excellent Nationals and the above-average Mets and Marlins. The AL Central has four pretty good teams, but the Tigers and Indians are both just a tick below the top tier of teams and the White Sox and Royals have some very serious flaws that could quickly become fatal.
Nevertheless, the Tribe is in a great position to compete in 2015. If their players to mostly hit their projections, they have decent enough health, and the Tigers and White Sox don't have amazing years, they'll have a pretty good shot of winning the division and will at least be in wild card contention the whole year. Things could get interesting this summer with Francisco Lindor possibly being ready to be thrown into the mix, which could have the benefit of placing Jose Ramirez in a utility player role that would let the Indians keep Jason Kipnis fresh, protect Lonnie Chisenhall from facing too many lefties, and give the pitching staff the infield defense they deserve. It's an exciting time to be an Indians fan, and their youth and team control make it likely that the excitement will continue.
0 comments :
Post a Comment